 Skip to content


Investing During Turbulent Times (COVID-19 Edition)
The rise of COVID-19 (coronavirus) globally has stalled international trade, created heightened volatility in the financial markets, and sparked an oil price war between Saudi Arabia and Russia.
Oil Price War
After Russia refused to cooperate with OPEC to prop oil prices by cutting down production, Saudi Arabia shocked the world today by slashing prices for the month of April by $6 to US $8 per barrel. As a result, the price of oil plunged (Figure 1).
This clash is actually a three-sided confrontation. The objective of Russia’s refusal to reduce production and prop up prices is to put pressure on oil producers in the US (shale oil producers who have higher cost basis than Russia and Saudi Arabia). Meanwhile, Russia’s refusal to cooperate has prompted the Saudis to reduce prices further to take market share from Russia.
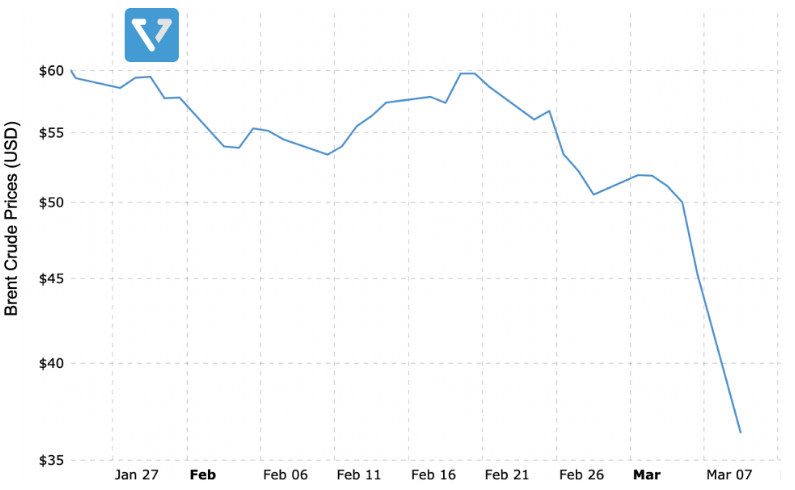
Figure 1: Oil price is plunging
Typically, a slide in oil prices results in the strengthening of the INR vs. the USD. However, that was not the case this time, as foreign institutional investors (FIIs) started selling off Indian equities and reallocating capital to bonds.
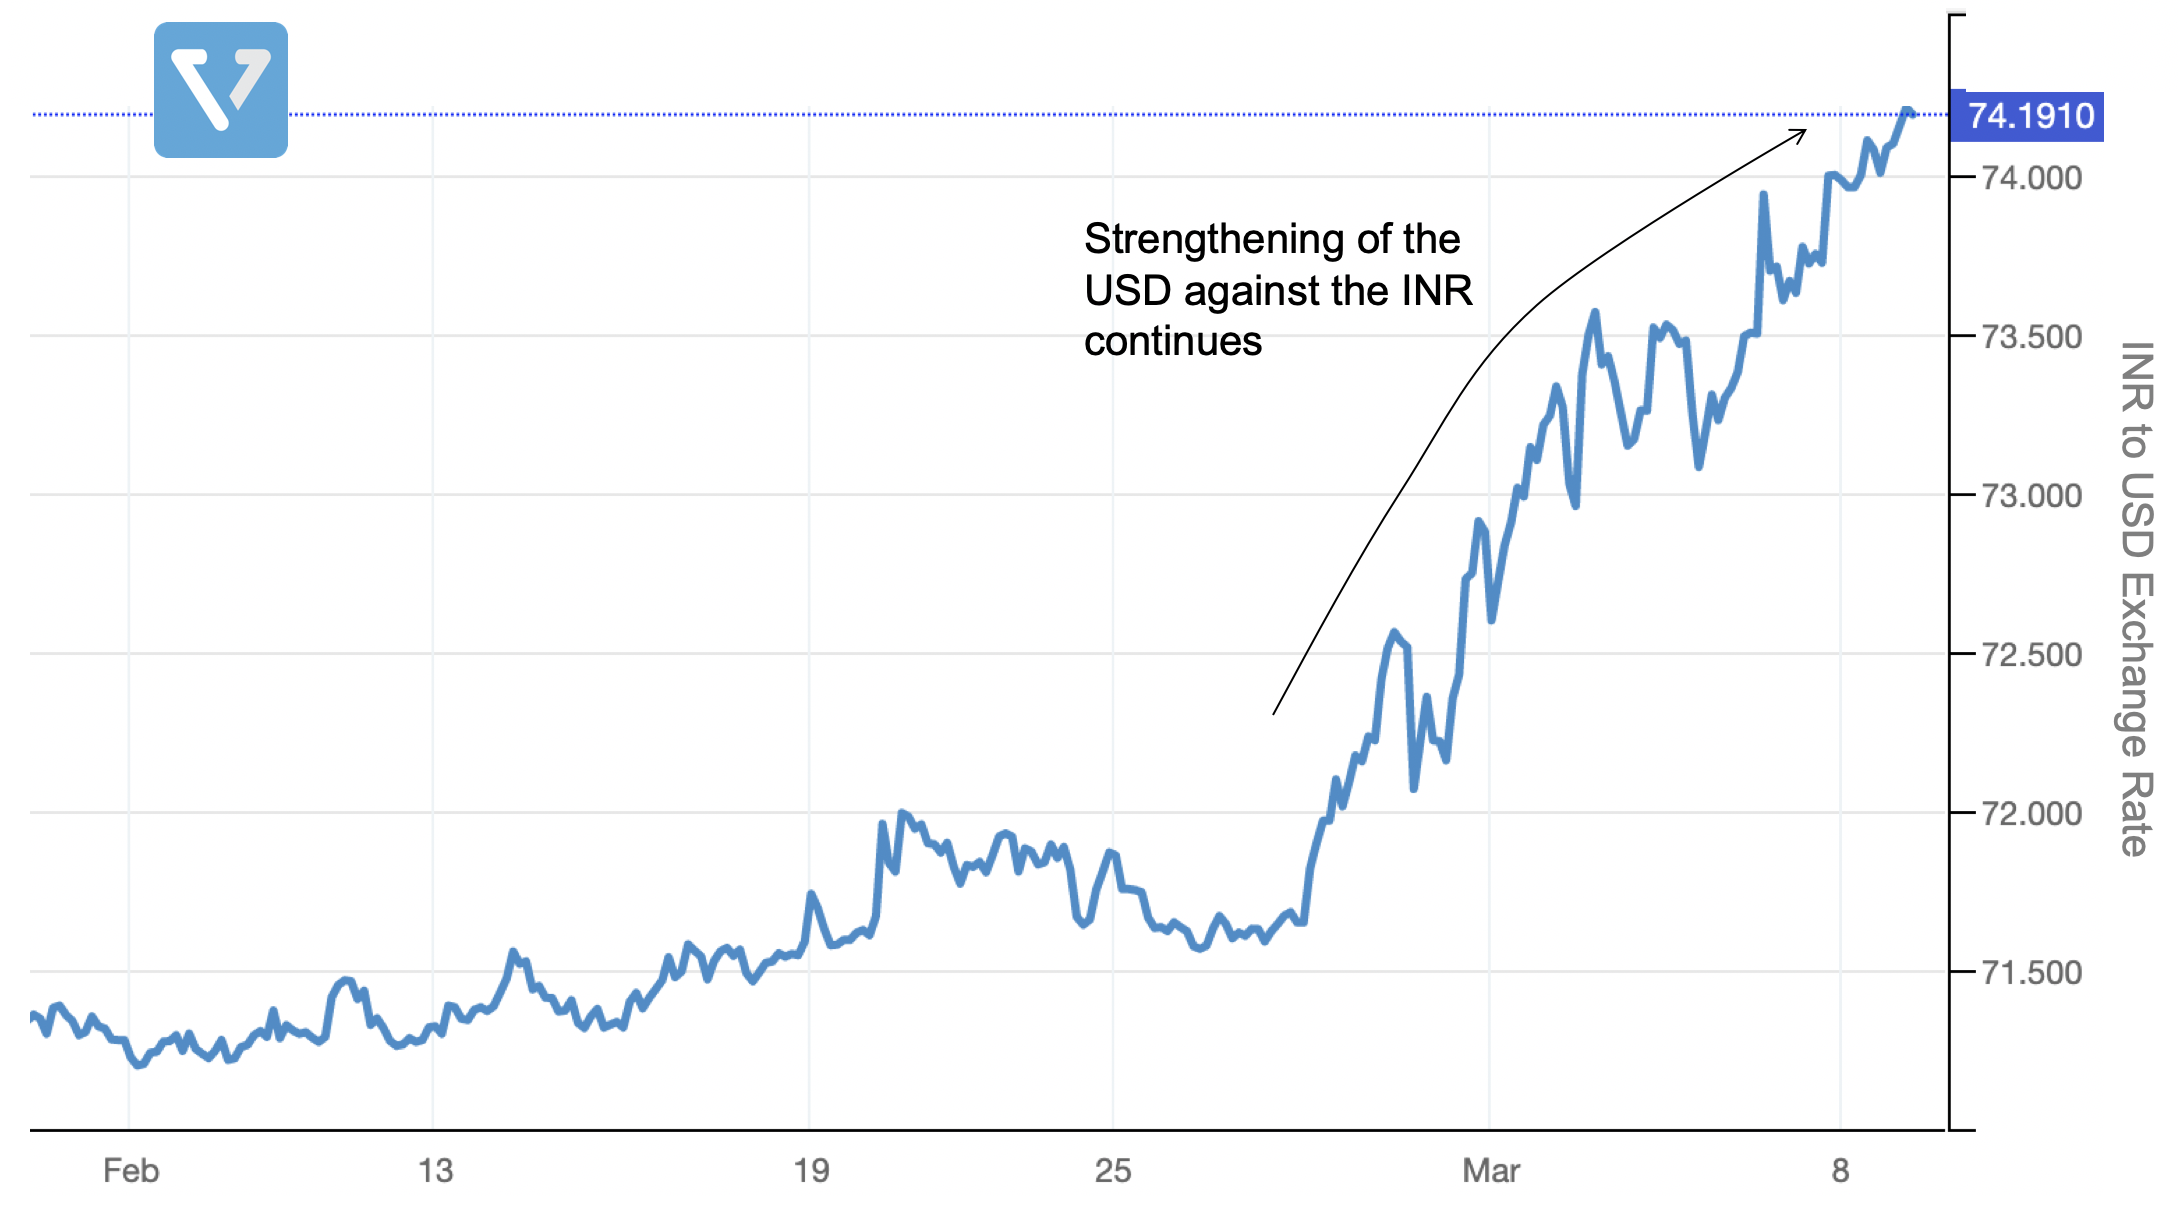
Figure 2: INR is losing its value vs. the USD
During these turbulent times, investors tend to adopt various strategies. We’ll cover 2 of them today: Buying the dip and multi-asset class investing.
Buying the dip
Warren Buffet once said: “Be fearful when others are greedy and greedy when others are fearfulâ€. Despite the recent market sell off, some investors remain in the market. One of these investors are hedge fund managers. According to Morgan Stanley, hedge fund managers have continued to be large net buyers. As a group, they’ve snapped up technology shares (particularly software makers), and are also net buyers of airlines, hotels, and restaurant stocks (sectors that are likely to experience the worst impact of the outbreak).
There are also reasons for investors to be optimistic. Before the widespread fear of the pandemic, the US economy was performing well. In the month of February, the US added 273,000 jobs, pushing down unemployment to a historically low figure of 3.5%. As such, some investors choose to buy the dip by investing in good companies that fundamentally have good businesses and sufficient cash flow to withstand the potential downturn.
The potential problem with this approach is that you may end up catching a falling knife (where the market continues to fall before hitting the bottom). Buying the dip is a market timing strategy, and more often than not, investors do not get the timing right, which leads to a phenomenon of selling low and buying high.
Multi-asset class investing
During times of heightened volatility, some investors’ move their funds towards asset classes that are deemed less risky/volatile. Two such asset classes are gold and bonds.
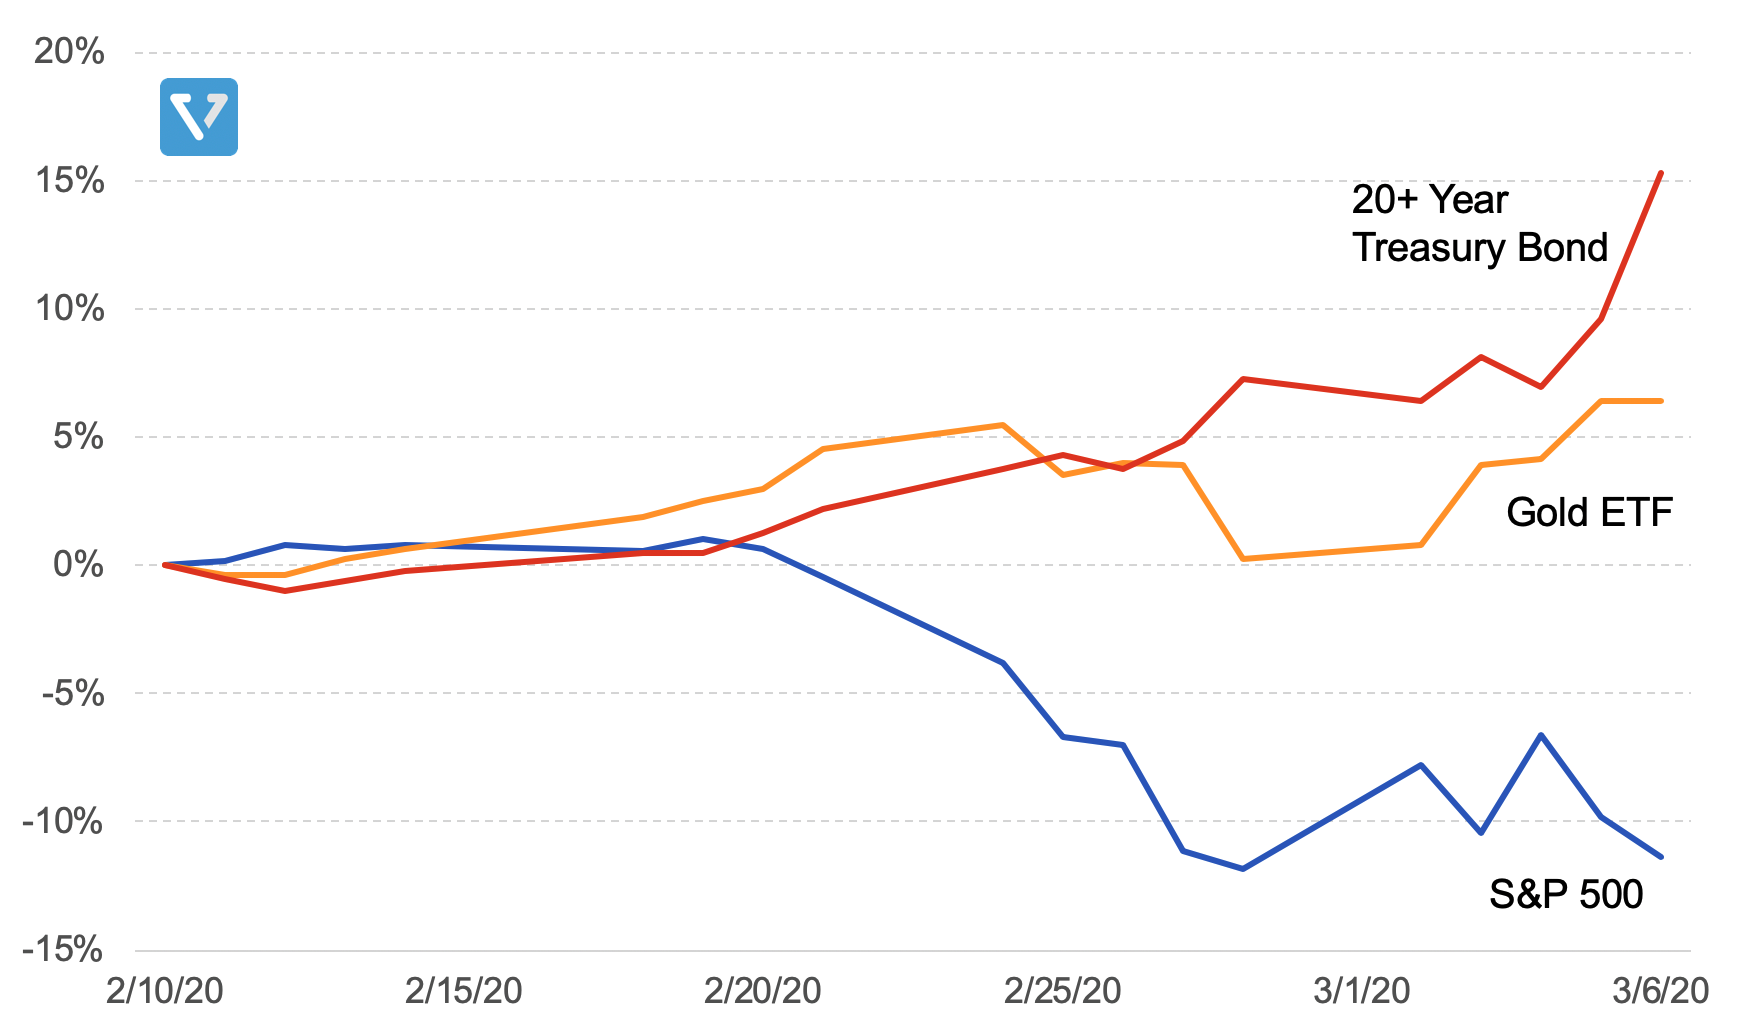
Figure 4: Price trend of S&P 500 vs. gold (we use iShares’ gold ETF: IAU) vs. long-term US treasury bonds (we use iShares’ 20+ year treasury bond ETF: TLT) from the past month
As the stock market took a turn (S&P 500), gold (ticker: IAU) and long-term US treasury bonds (ticker: TLT) increased in value. These two asset classes have low or negative correlation with the stock market. In fact, data from the past decade shows that the long-term US treasury ETF and gold have correlations of -0.46 and 0.04 respectively when compared to the US stock market.
This means that investing in these two asset classes may be beneficial for downside protection. However, it doesn’t mean that investing in these two asset classes alone will be good for your portfolio.
Figure 5 shows a hypothetical investment growth of US $10,000 from 2006 to now. Gold strongly over-performs during the crisis of 2007 (and the 2-3 years after), but largely under performs the 6-7 years following that, up to 2020. Similarly, long-term treasury bonds perform well when the stock market goes down, and conversely, go down when the market is performing well (negative correlation).

Figure 5: Hypothetical portfolio performance of investing in stocks only (S&P 500, we use Vanguard’s ETF to represent this asset class) vs. Gold (we use iShares’ gold ETF: IAU) or long-term US treasury bonds (we use iShares’ 20+ year treasury bond ETF: TLT)
Again, timing the market is exceedingly difficult. For most investors, it is best to create a well-diversified portfolio by investing in multiple asset classes that give a balanced risk exposure over various macroeconomic conditions.
On our platform, we have such a portfolio – the All Weather Vest. This Vest invests in multiple asset classes such as US stocks, gold, commodities, long and medium term US treasury bonds.
Figure 6 shows the performance of three hypothetical portfolios: (1) US stocks only (S&P 500), (2) All Weather portfolio, and (3) a traditional mix of 60:40 stocks to bonds ratio.
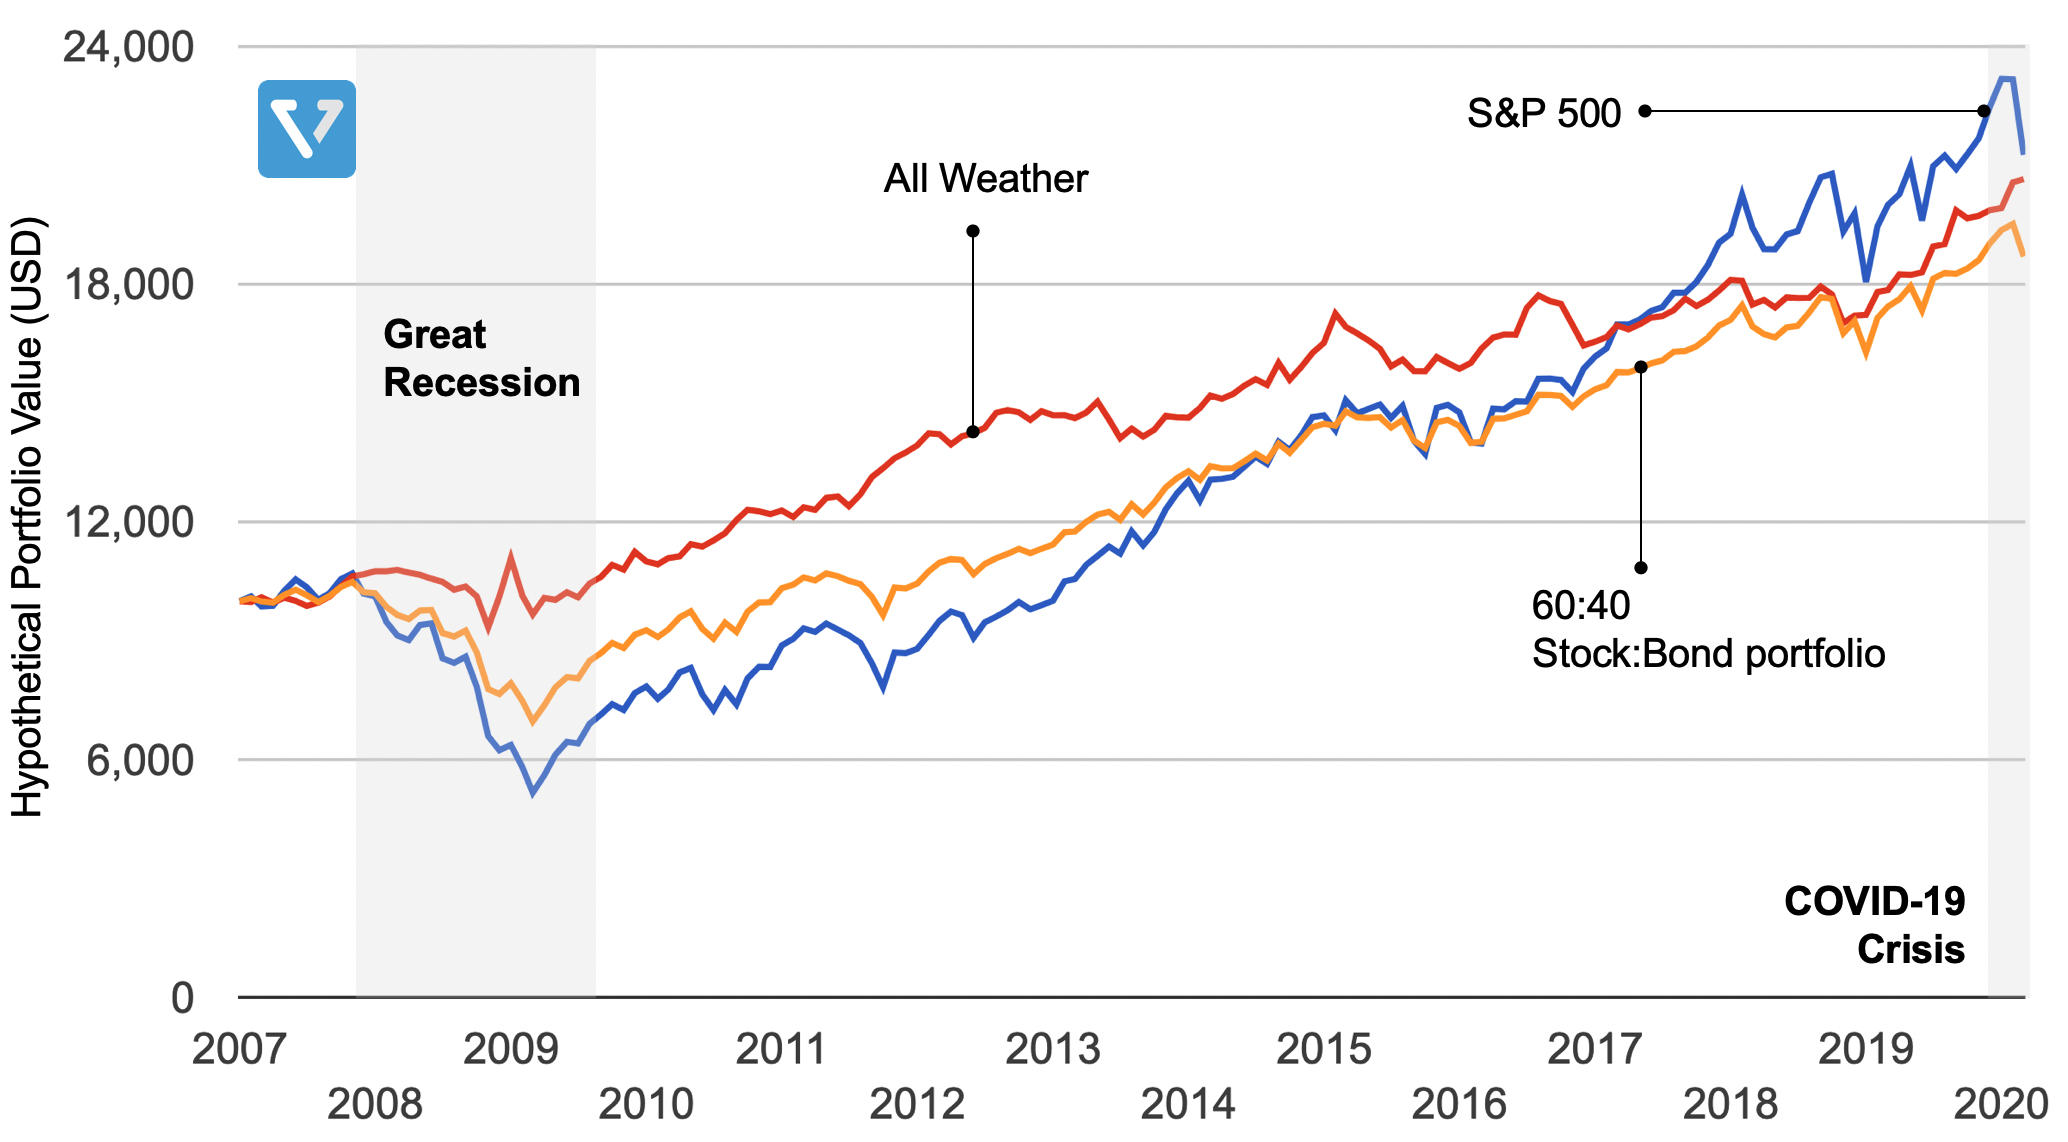
Figure 6: Hypothetical portfolio performance of investing in (1) US stocks only (S&P 500), (2) All Weather portfolio, and (3) a traditional mix of 60:40 stock to bonds ratio. Performance of the S&P 500 was simulated with Vanguard’s 500 Index Investor Fund (ticker: VFINX), while the performance of the 60:40 stocks to bonds portfolio was simulated with Vanguard’s Balanced Index Fund (ticker: VBINX). Analysis was performed assuming that the portfolio is rebalanced annually
For the time period examined here:
- Investment in the S&P 500 yields the highest annual growth rate (CAGR of 7.86%), however, the volatility in this investment is the highest as well. The average standard deviation of the S&P 500 in the past 13 years is 14.71% (annually), with a maximum drawdown of 50.97% which happened during the great recession.
- A 60:40 bond and stocks portfolio is more efficient on a risk-adjusted basis (the Sharpe ratio is higher than pure stocks), but the correlation with the US market is 0.99.
- Meanwhile, the All Weather portfolio achieves the smallest drawdown, lowest level of volatility, and lowest US market correlation. On a risk-adjusted basis, the All Weather portfolio provides the most efficient portfolio (highest Sharpe Ratio)*.
*Note that this information is not intended as investment advice. Past performance does not guarantee future returns.
See Table 1 for the descriptive statistics.
Table 1: Portfolio Statistics
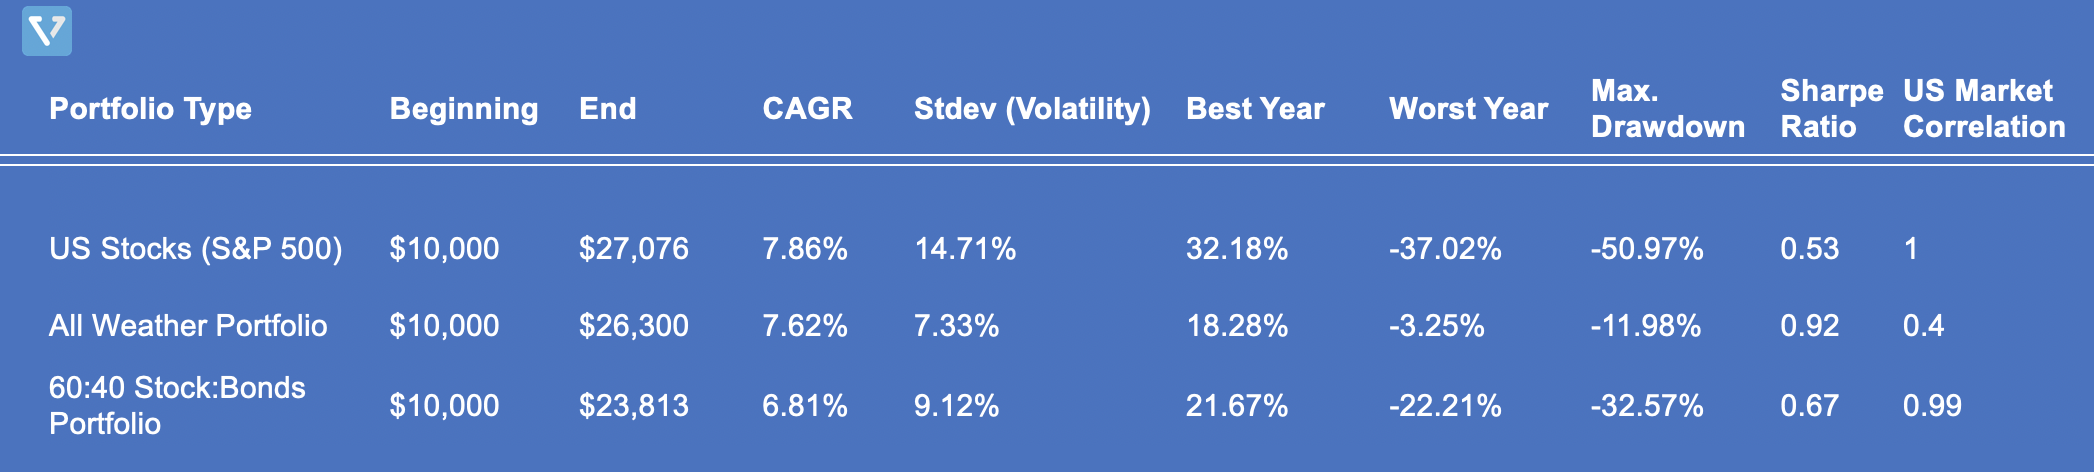
Note that the ending values in the hypothetical portfolios are not adjusted for inflation.
Closing thoughts
In the next few weeks and months the news coverage will be relentless in terms of the volatility of the market and the global economy (it’s their job, after all). One thing to keep in mind is that while no one can predict the future, and past performance is no guarantee of future returns, it is worth taking a step back from the everyday headlines to look at the long history of the US financial market, which has withstood multiple world wars, oil crises, and bouts of recessions and depressions.
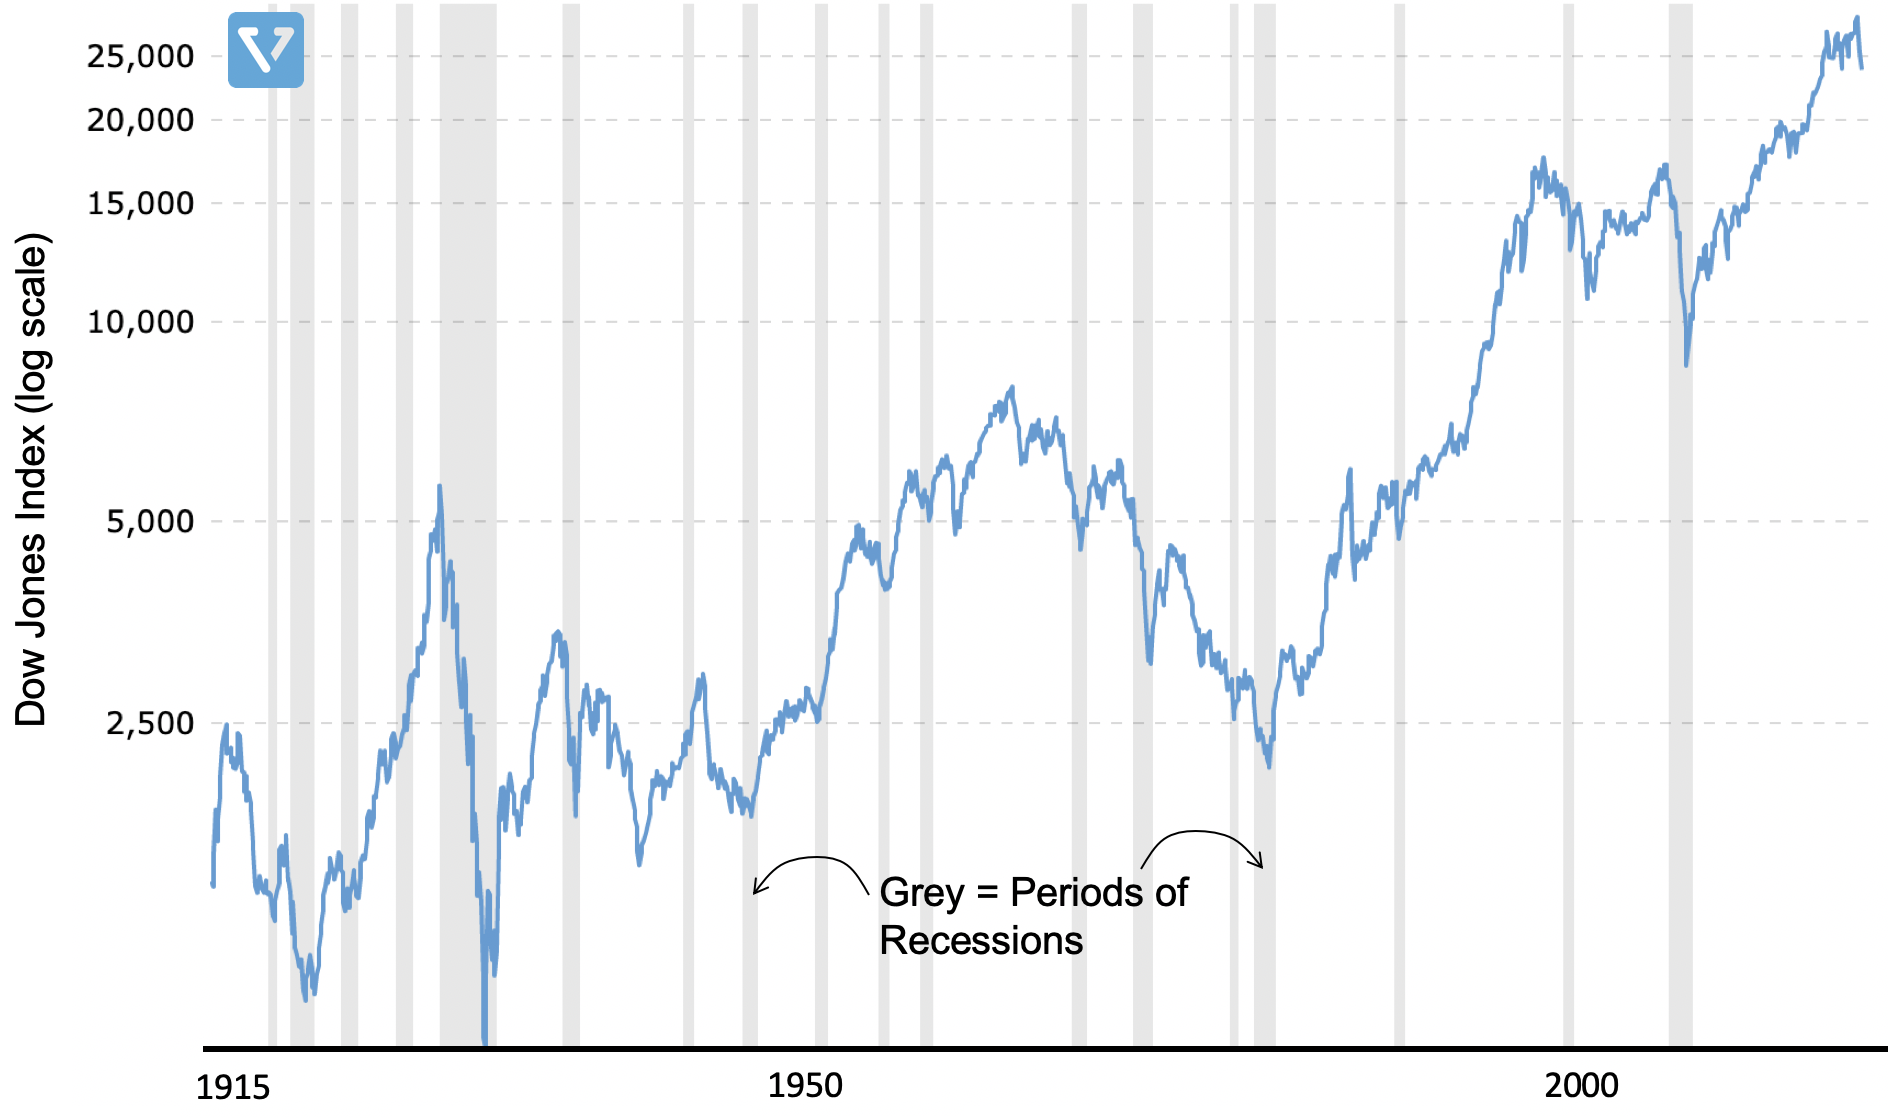
Figure 7: Dow Jones Industrial Index History, dating back to 1915. We shift to DJIA index vs. S&P 500 because Dow Jones is the oldest index – and therefore we have the most historical data.
